Introduction to Feynman Diagrams
INTRODUCTION
TO
FEYNMAN DIAGRAMS
View my previous article here -
View the next article here -
-----------------------------------------
Feynman diagrams are diagrams that are used to show the interaction among particles.
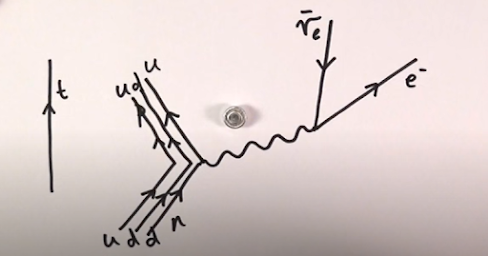
For e.g., if we had to show the beta minus decay using the Feynman diagram -
( In beta minus decay - a neutron decays to proton and in the process, creates an electron and an electron antineutrino.)Explanation -
- First, we draw the path of the neutron, which is represented at the bottom left of the image. "u" represents the up quark and "d" represents the down quark.
- Next, we draw the squiggly line, to show the weak interaction during beta decay. The path shown on the top left shows that of a proton which is a product of beta decay. We also understand that only one of the down quark changes to an up quark.
- On the top right, we notice an electron emerging, which has been denoted by e-.
- We also see an electron antineutrino whose direction has been denoted towards the squiggly line since it is "anti".
Similarly, we can draw Feynman diagrams for several such interactions. The squiggly line is used to show the interaction between particles.
Do not miss this article to know more about Feynman diagrams!
-----------------------------------------
View the next article here -
View my previous article here -
View a more structured order of the articles here -
-----------------------------------------
Feel free to ask/share anything additional in the comments section!
I am still learning Particle physics, but will try my best to answer your questions :)
Kindly let me know about any errors here.
Kindly let me know about any errors here.
You can also share anything additional for this article here.
View my previous article here -
View the next article here -
View a more structured order of the articles here -
See more articles here -
Solve brain teasers! View my other blog here-
With Warm Wishes,
Lavanya


Comments
Post a Comment